This post will demonstrate that prices of pharmaceutical imports have grown more quickly after countries adopted data exclusivity in their laws. Data exclusivity is a form of intellectual property protection that prevents generic entry by preventing generic firms from relying on the originator’s test results to win regulatory approval. A longer explanation is here.
I also intended to demonstrate that trade data can be a useful source of information for studies of drug pricing.
The post is based on my presentation given at pre-Global Congress workshop on empirical research into the effect of TRIPS-Plus trade agreements on access to medicines.
Why examine import prices to measure pharmaceutical price changes?
Policy advocates are interested in studying the effect of TRIPS+ intellectual property rules on pharmaceutical prices, yet publicly available price data is scarce. The best source for cross-country, multi-year medicine prices is IMS, which is prohibitively expensive for most researchers. Furthermore, the impact of TRIPS-Plus provisions may appear gradually. They typically only apply to new drugs coming on the market, and if countries already had TRIPS-level patent protection in place, then certain TRIPS-plus policies will not impact prices of newly approved drugs until the end of their patent terms.
Due to this scarcity of data and gradual overall impact of provisions, trade data might be well suited to demonstrate the impact of TRIPS-Plus provisions on medicine prices. There is a lot of available data, and it covers a long period of time, which is why trade economists in other fields have used data on trade shipments to build indicators of the price of imported goods.
UN’s Comtrade is a widely used source of trade data. It reports quantities and payments of commercial shipments as recorded by border authorities. Unlike published prices, it reports the actual amounts of money paid at the wholesale level. However, there are potential problems using Comtrade data to show the impact of policies on drug prices. Comtrade does not have data for imports and exports of particular drugs, it does not distinguish between branded and generic drugs, and it is very noisy.
Comtrade has data on the annual value (in U.S. dollars) and volume (in kilograms) of imports and exports of pharmaceuticals between countries, disaggregated by product classes using the international Harmonized Commodity Description and Coding System. This is commonly referred to as the Harmonized System, or HS. The data is available at the two-, four- and six-digit level of the HS – the more digits, the more precise the product class. The breakdown allows one to see changes in the price per kilogram of pharmaceuticals trade in certain classes of drugs over time. One can compare the change in this price metric in countries that have implemented data exclusivity to the change in this price metric in a set of control countries that have not.
Alternatively, one can look directly at the amount of money being spent on imports and the quantity they receive – answering the question “when countries pay more, are they receiving more for the higher payments?”
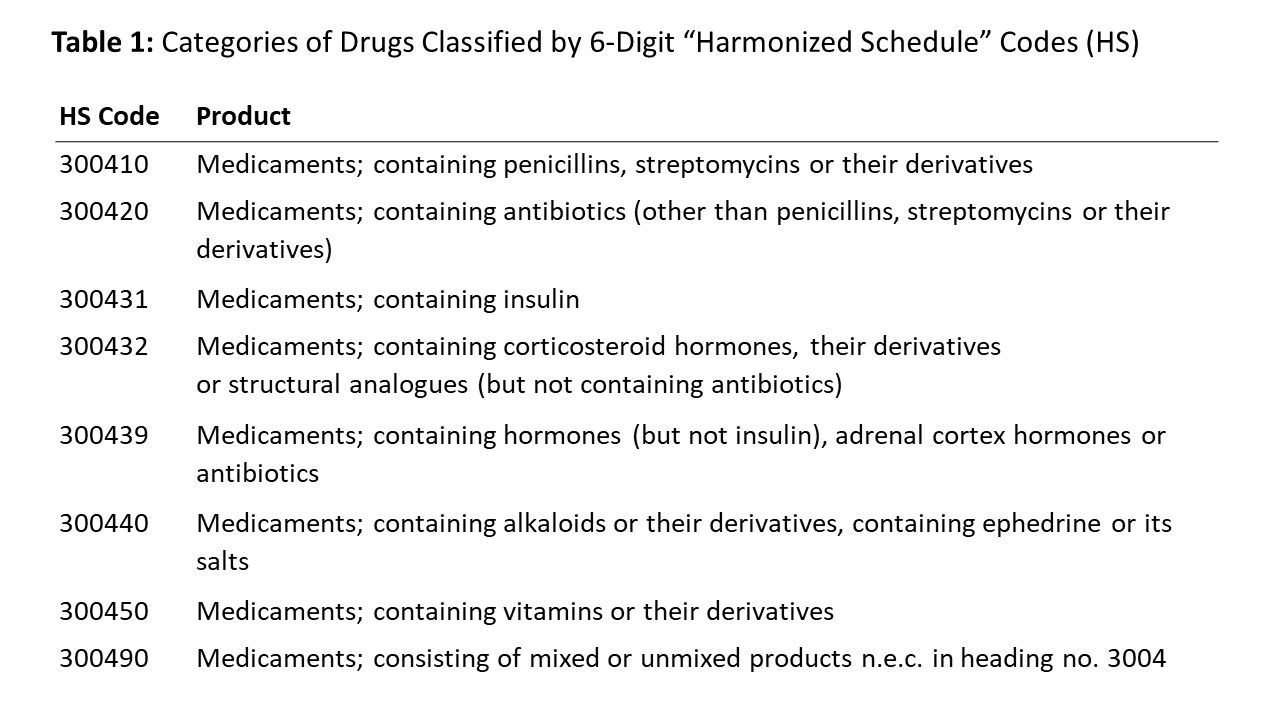
Comtrade has data on 8 HS classifications of medicines,shown in Table 1 with the names slightly abbreviated.[1] All of these are shipments of packaged medicines for human consumption, rather than active pharmaceutical ingredients or other unmixed pharmaceutical products. Comtrade has data on the price and quantity of medicines in each HS code that each country imported from (or exported to)each other country. There is a lot of data on the prices. The data on quantities is less complete, though it is still fairly thorough. The data goes back as far as 1988 for some country pairs, but for most it goes back to the early 1990s.
Identifying policy change: data exclusivity
To address the effect of data exclusivity on the price of drug imports, we need information on when countries implemented data exclusivity in their laws. An off-the-shelf source of this information is the 2011 IFPMA report Data Exclusivity: Encouraging Development of New Medicines. It does not include any information on the state of each country’s law before the implementation of the current data exclusivity protection, so it requires the assumption that when countries passed the law in the report, they went from having no exclusivity at all to having data exclusivity. Nonetheless, it is a readily available source of information one can use to estimate the year when data exclusivity took effect in a 42 countries. Table 2(a) lists the countries.
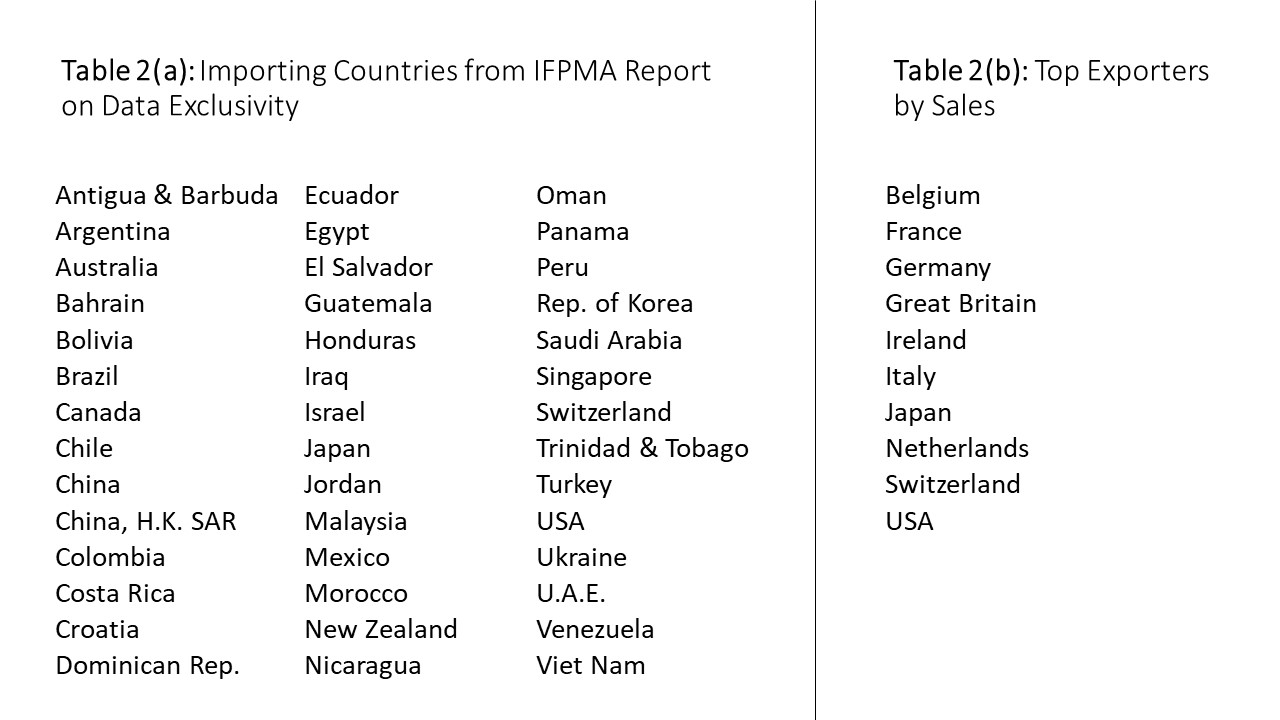
EU Member countries are included in the IFPMA report, but I am omitting them from my analysis because the report points to the regional-level law on data exclusivity.
Data on pharmaceutical imports
This analysis uses data on imports by these 42 countries from the top 10 exporting countries, as identified by worldwide exporters in Comtrade. These are listed in Table 2(b). They are the top exporters by sales –not by volume – because I wanted to try to capture more branded and less generic shipments.
For each of the 42 importing countries, I download the value and the volume of annual imports by HS code from any of the top exporting countries, and use it to create data on price per kilogram by importer-exporter-drug classification. For instance, “Medicines containing penicillins imported by Antigua & Barbuda from Belgium.”
The average price per kilogram in the dataset is $289 US dollars, but there is a large standard deviation. The data is very skewed inits raw form, but it logs normal, as shown in Figures 1(a) and (b). Another way to look at the data is shown in Figure 2(a) and 2(b), which show the annual unlogged mean price per kilogram,disaggregated first by drug classification, and then by exporter.
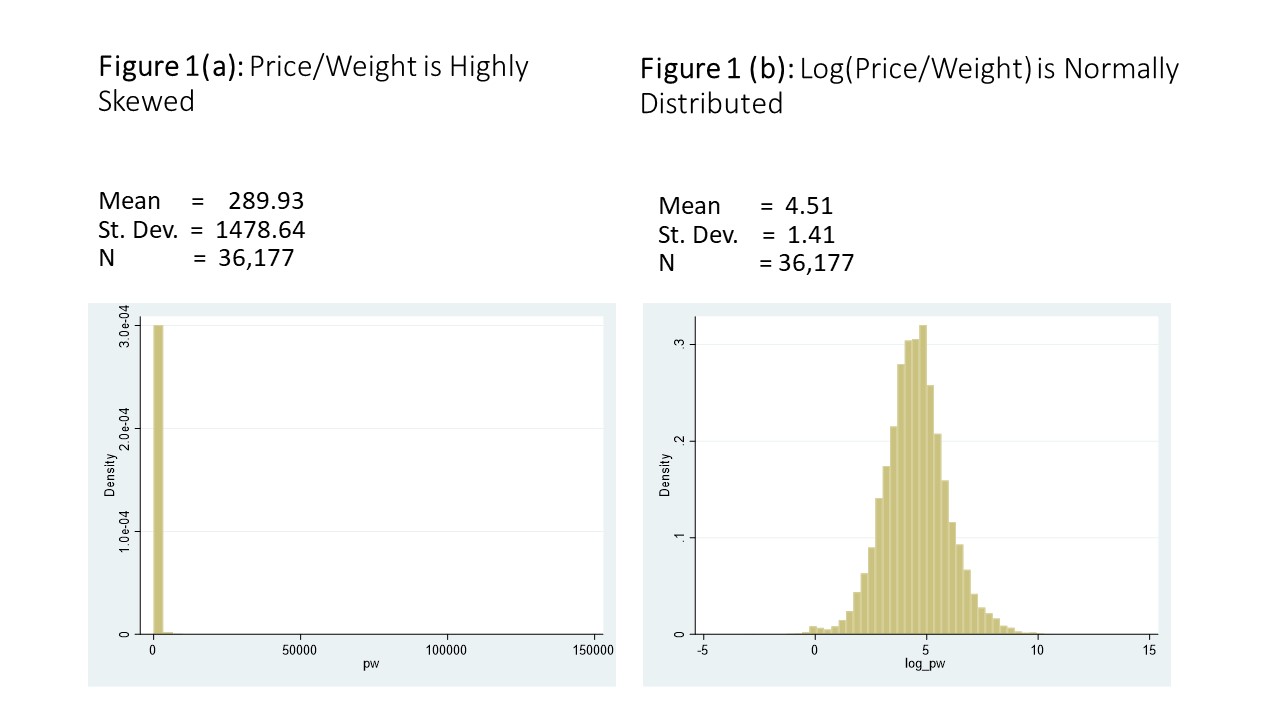
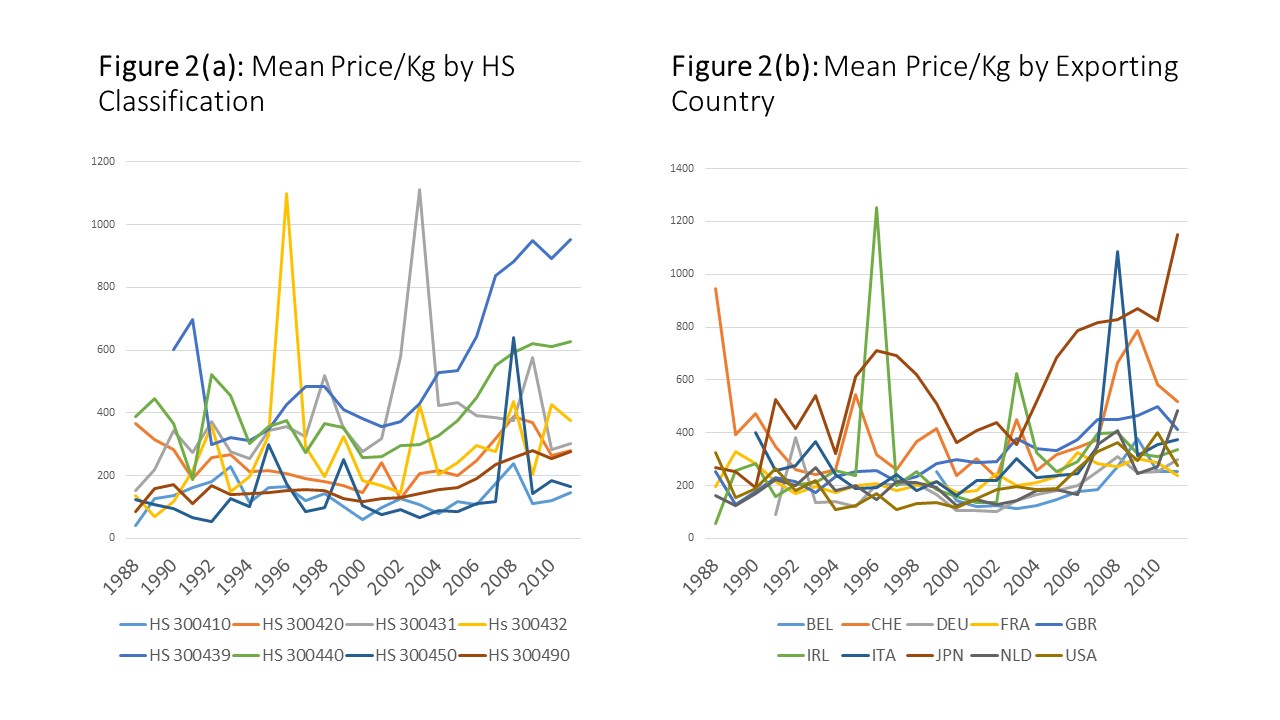
Figure 2(a) demonstrates that prices for some classes have risen – especially for HS 300439 (which are “Medicaments; containing hormones(but not insulin), adrenal cortex hormones or antibiotics”) – but for some prices have stayed relatively constant.
Figure 2(b) presents imports by exporting country, and it shows a more clear upward trend. However, the data is noisy in both panels.
Measuring the impact of data exclusivity on pharmaceutical import prices
This section will demonstrate that pharmaceutical import prices have risen more quickly in countries with data exclusivity than in countries without.
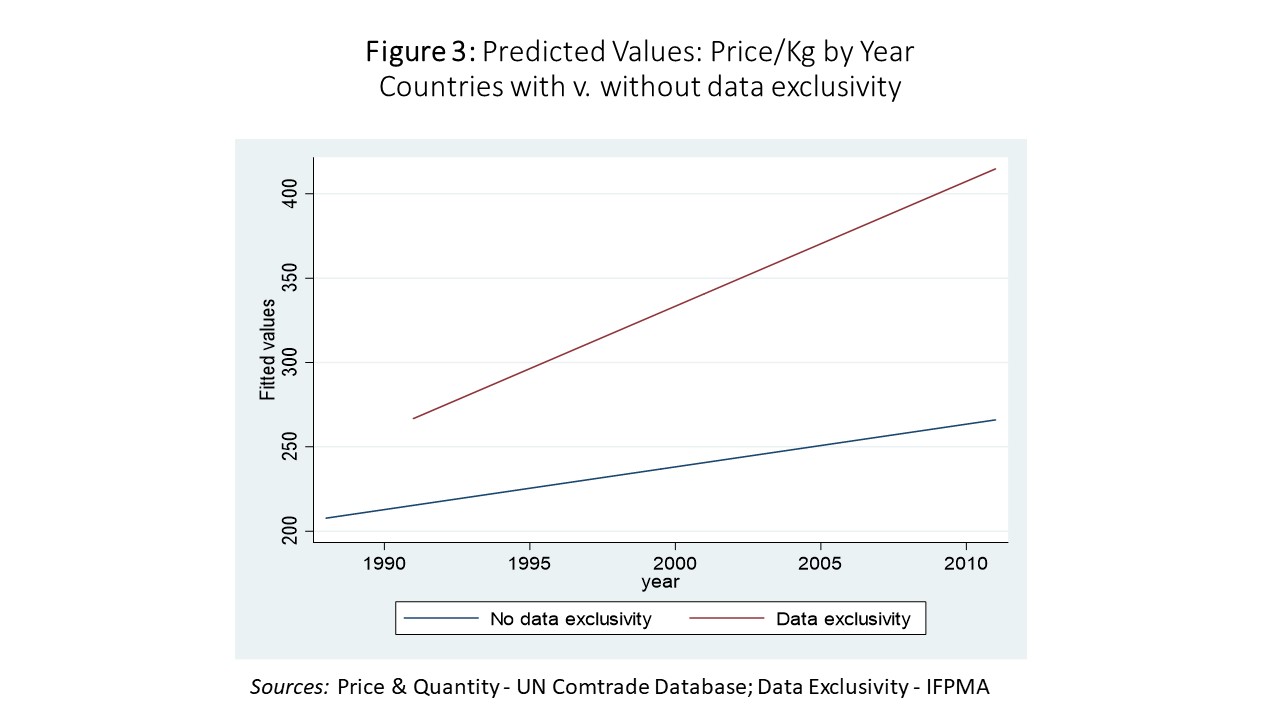
Figure 3 shows the average price per kilogram per year of pharmaceutical imports for countries without data exclusivity in blue, and countries with data exclusivity in red. Average prices rise for both groups, but the rate of growth is faster for the countries with data exclusivity.
Next, I run regressions show the time trend for countries with and without data exclusivity, and to control for fixed effects for importing countries, exporting countries and HS classifications. The results are shown in Table 3.
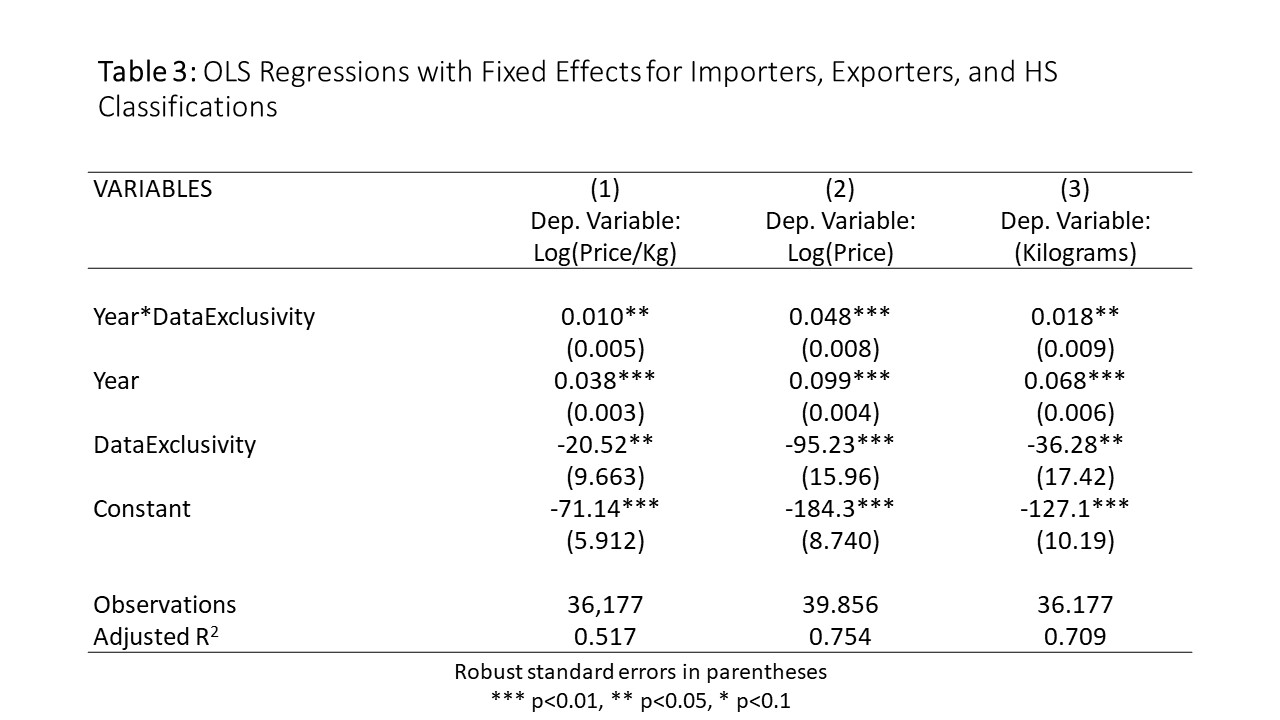
The first column shows the results of a regression where logged price per kilogram is the dependent variable. The results can be summarized as follows:
- On average, the price per kilogram of drug imports for these countries without data exclusivity grew 3.8% per year…
- …but the price per kilogram of drug imports for countries with data exclusivity grew another 1% faster each year (4.8%)
- The difference may seem small, but it becomes important as it compounds. It implies a doubling of prices in the data exclusivity countries four years before a doubling of prices in the non-data exclusivity countries.
Looking instead at rows 2 and 3, you see the same story,told differently. Column two shows a change in the amount paid by importing countries and column 3 shows the quantity imported. Both are rising overtime, but the price is rising faster – so countries are paying more but they are getting less for their money. And this is more true in countries that implement data exclusivity.
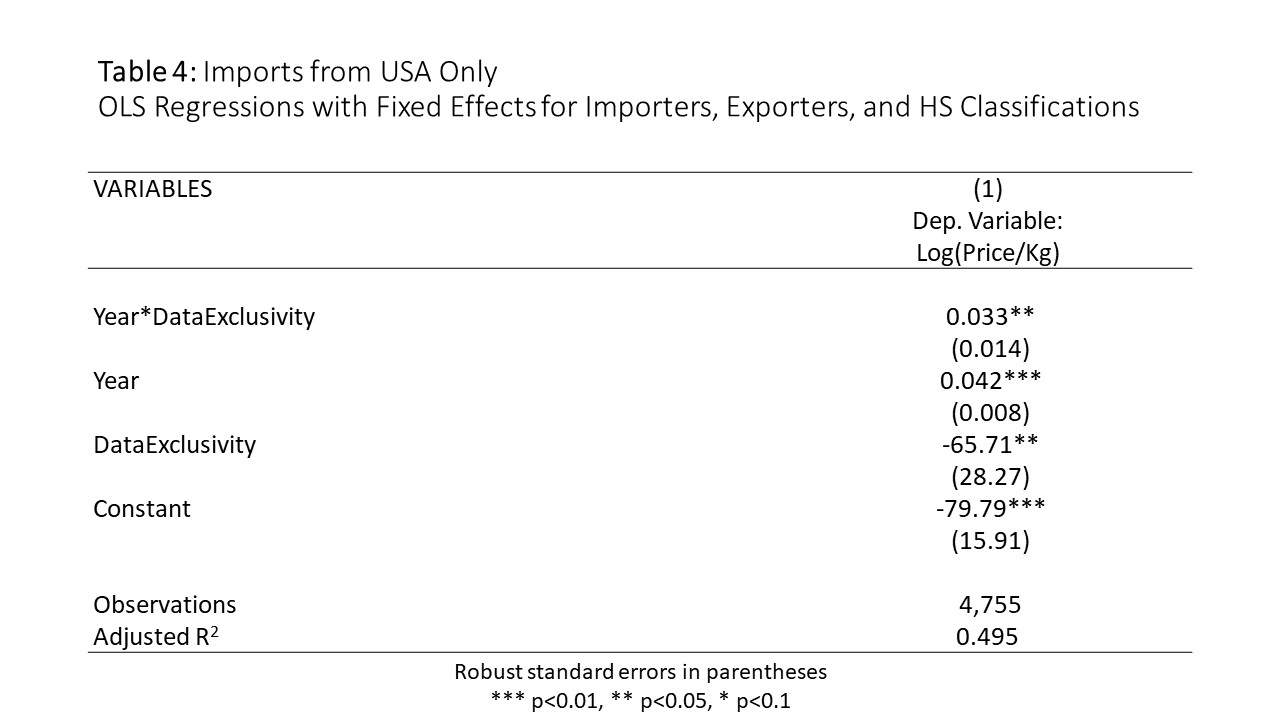
Table 4 repeats the regression in column one, using only data on imports from the United States. The rate of price increase is higher.For this subset, pharmaceutical import prices rose 4.2% a year (on average) in countries without data exclusivity,but prices rose 7.5% a year in countries withdata exclusivity.
Conclusion and ideas for further research
This post presents empirical evidence that prices of pharmaceutical imports rise more quickly when countries implement data exclusivity. It demonstrates that trade data can show price movements overtime, including the gradual impact of TRIPS-Plus IP provisions on aggregated price levels.
There is plenty of room for further research. One could look more closely at specific classes of drugs, especially if one identifies a class(or classes) that is more important than the others in the delivery of healthcare. One could also look more closely at specific importers and/or exporters.In some cases, individual countries’ border authorities have more disaggregated data, which could be very useful in this type of analysis. Finally, a more thorough review of legal changes – including the state of the law before the current law on data exclusivity – may give a more precise metric of the timing of legal change.
FOOTNOTE:
[1] For the most recent year there are some other HS codes, but this is only for 2017. So if you want to look at changes over time, these are the 8 classes.


