 Gabriel Michael, Link (CC-BY-SA)
Last Thursday, Wikileaks released a draft text of the intellectual property (IP) chapter of the Trans-Pacific Partnership (TPP) agreement. The TPP is a free trade agreement currently been negotiated between 12 countries: the United States, Canada, Mexico, Peru, Chile, New Zealand, Australia, Singapore, Malaysia, Brunei, Vietnam, and Japan. Like many FTAs, the TPP has been negotiated in a secret, non-transparent fashion, with access to draft texts provided only to lobbyists and the like. Wikileak’s release of the IP chapter thus provides an important opportunity for academics, activists, and the public to examine what is being negotiated in their name.
Many others have already provided analyses of the text; if you’re interested, I recommend checking out Susan Sell, Michael Geist, Jamie Love, and Margot Kaminski. Apart from what the text says, however, another interesting feature of draft texts is the inclusion of information about which negotiating party is taking a position on a given issue.
For example, in the TPP IP chapter, we have the following snippet, found in Article QQ.A.5:
(a) The obligations of this Chapter do not and should not prevent a Party from taking measures to protect public health by promoting access to medicines for all, in particular concerning cases such as HIV/AIDS, tuberculosis, malaria, [US oppose: chagas] and other epidemics as well as circumstances of extreme urgency or national emergency.
Here, the “[US oppose: chagas]” indicates that the inclusion of the word “chagas” is disputed, and that the United States is the one opposing its inclusion in the text. “Chagas” refers to Chagas disease, a form of trypanosomiasis, which is a parasitic disease primarily affecting Latin America.[1]
These little snippets provide a lot of information about country negotiating positions. Often, they include more than one country, as in the following example:
[CL/NZ propose; US/AU/JP/MX oppose: 2. Nothing in this Chapter shall derogate from existing rights and obligations that Parties have to each other under the TRIPS Agreement or other multilateral agreements, such as those concluded or administered under the auspices of the World Intellectual Property Organization (WIPO), the World Health Organization (WHO) and United Nations Educational, Scientific and Cultural Organization (UNESCO).]
Here, we see that Chile and New Zealand have proposed the inclusion of a sentence specifying that the TPP should not contravene other international agreements, while the United States, Australia, Japan, and Mexico oppose its inclusion.[2]
There are hundreds of these indicators sprinkled throughout the chapter, each indicating when one or more countries propose, oppose, or want to comment on a provision in the text. However, some groupings of countries are more common than others. By systematically collecting and examining these groupings, we can find some interesting patterns.
First, we can list the frequency of country dyads: i.e., how often two countries appear in the same grouping together. This gives us a sense of how much these countries’ interests overlap in the current text. The following chart reports the frequency of every unique, unordered country dyad. For example, in rank 43, we can see that “AU-US” (Australia and the United States) appear together in country groupings 83 times.

Already, we see some interesting patterns. At the very top of the chart, we have some unsurprising dyads: Malaysia-Singapore (140 pairings), Malaysia-Vietnam (120), Brunei-Vietnam (129), Brunei-Malaysia (128). However, we also have surprises: the top place goes to Chile-Singapore (140), and third place goes to Chile-New Zealand (132). One might have expected more concordance between Australia-New Zealand (117), which does not appear until position 16.
There is far less concordance between the U.S. and countries we might normally consider to be “partners” than one might expect. Indeed, the U.S. does not even appear on the list until position 43, meaning that out of 66 possible dyads, 42 others appear together more times than the U.S. appears with anyone. U.S.-New Zealand dyads ranks 49th, U.S.-Canada dyads 54th, and U.S.-Japan dyads rank 59th. This gives us a rough sense that the U.S. may be relatively isolated in its negotiating position. The same seems to be true of Japan.
Another approach we can take is to measure the frequency with which country codes appear by themselves. These “sole-country proposals” indicate that no other party is willing to join the first party in support, opposition, or comment:

We might have expected the U.S. to take first place, but it turns out to be Canada, with the U.S. and Japan following well behind. Of course, this chart doesn’t tell us what Canada is proposing or opposing by itself. It could well be that Canada is the sole party capable of opposing controversial provisions.
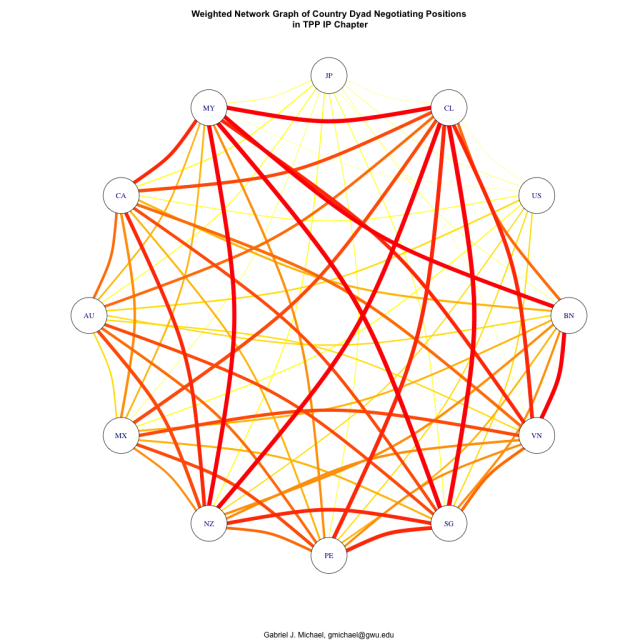
These bar charts are fun, but we can do better. What if we wanted to get a sense of the degree to which every negotiating party is connected to every other negotiating party? That’s a job for a network graph. Furthermore, we can weight the connections of the network according to the number of times country dyads appear in the text. The following chart takes this approach, adding in some colors to make the weighting more evident:

It’s immediately evident that the U.S. and Japan overall have the weakest connections to all other dyads, while Chile and Singapore have the strongest. There are surprisingly strong connections between Canada and Vietnam (ranking 23rd overall), New Zealand and Vietnam (30th), and New Zealand and Brunei (31st).
Since every party has some connections to every other party, the above network graph is a bit busy. We can limit it to just the negotiating parties with large numbers of connections to one another. The following graph uses the third quartile as a cutoff point; countries with fewer connections than this cutoff do not appear in the graph:

There’s an interesting core of New Zealand, Singapore, Chile, and Malaysia (though the direct connection between New Zealand and Singapore is weaker than the others). Peripheral parties connect with the network via sensible routes: Mexico through Chile, Australia through New Zealand, and Brunei through Vietnam and Malaysia. Canada’s connection through New Zealand makes sense, though the connection via Malaysia is odd; likewise, Peru via Chile makes sense, but via Singapore is surprising. The numbers report the raw count for the given dyad.
Finally, I thought I’d redo the large network graph, but this time include sole-country proposals as loops. This allows for a direct comparison of the data from the first two bar graphs, and gives us a sense of the degree to which a country is joining with other parties versus “going it alone”:

The U.S. and Japan are still relatively isolated, but we can also see that they’ve made numerous sole-country proposals, perhaps accounting for their relative isolation. Though Canada has the highest number of sole-country proposals, it also has strong connections to many other parties. Singapore, Peru, Malaysia, and Brunei have so few sole-country proposals that their loops are barely visible.
To sum up, what can we conclude from these data?
- The U.S. and Japan are relatively isolated in their negotiating positions.
- There appears to be a strong negotiating network between Singapore, Chile, Malaysia and New Zealand.
- Canada is up to something!
Nuts and Bolts
If you’re interested in the technical aspects of how I created this dataset, read on.
If you’ve looked at the draft text, you’ve probably noticed that all the country groupings follow a rough pattern: a two letter country code followed by a “/”, followed by a two letter country code, repeated to the end of the group. The pattern is made more complex by the potential for numerical footnotes to intervene after country codes.
The first step is to extract these country groupings from the draft text. Regular expressions are the go-to tool for this type of task. I wrote a Perl script to read in the draft text and extract these groupings. For reference, the regex is in the following line:
print "$_\n" for @match = $txt =~ m/(?:(?:AU|BN|CA|CL|JP|MX|MY|NZ|PE|SG|US|VN)[0-9]*\/)+(?:AU|BN|CA|CL|JP|MX|MY|NZ|PE|SG|US|VN)[0-9]*/g;
It’s ugly, but it seems to get the job done. If you have suggestions for improving it, feel free to send them my way. I tested this regex, and it appears to catch nearly all the country groupings, for a total of 524.
The Perl script produces a text file with one line for each country grouping. A slight modification of the script produces a separate file that includes country codes appearing by themselves (a total of 550). I strip footnote numbers from the output and make a few other minor translations before reading the data into R.
Within R, I produced the 66 unique, unordered combinations of country codes, then used a nested apply function to produce a 66×524 matrix reporting a logical value for each dyad in each row of the input file. Summing the rows produces the frequency for each dyad. The process is roughly the same for the sole-country proposals, but with some additional complications.
From there, the bar graphs are easy to produce. The networks graphs are produced with the R igraph package, which I just discovered Friday. An alternative approach would have been to use something like D3.js, which looks pretty awesome, but I’m much more familiar with R. Data and code available upon request. Feel free to use the graphs which, along with the entire post, are licensed CC BY-SA 3.0.
[1] Determining what critical U.S. trade interest is served by opposing the naming of Chagas disease in this list is left as an exercise to the reader.
[2] If you’re wondering why the U.S. et al. oppose this sentence, it’s likely because they don’t much care for the work of the WHO and UNESCO as it affects intellectual property. Even WIPO has been far too development- and limitations/exceptions-oriented lately for U.S. tastes.


