Image: EFF (CC-BY)
The newly leaked May 16 draft of the Trans Pacific Partnership intellectual property chapter confirms previous reports that negotiators are discussing plans to postpone some of the TRIPS-Plus obligations on intellectual property and pharmaceuticals for some of the countries involved.
It includes as an addendum a “Proposal on Patent Pharmaceuticals Transition Periods” that would establish three “categories” of country, which are relatively high, middle, and low income. The relatively middle and low income countries would have transition periods that delayed their obligations related to patent extensions, linkage, and data exclusivity. After relatively short transition periods, all countries would have to apply the TRIPS-Plus rules that the World Health Organization warns may have “adverse impacts on access to medicines.” (p.72)
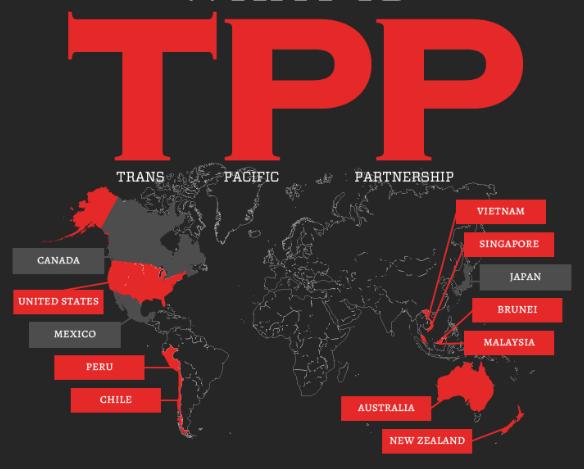
In the proposal, the U.S., Japan and Singapore are in Category A; Mexico and Brunei are in Category B; and Peru and Vietnam are in Category C. The other countries had not been categorized by the time the draft was written (though they may be by now). There is no guidance on the criteria used to categorized them, or to categorize other countries that may join the agreement after the terms are negotiated (note that category B has a high income country and a middle income country). Public Citizen has a detailed analysis of the proposal.
However, previous reports had focused on the idea establishing a threshold for delayed implementation using the current World Bank high-income threshold of $12,616 Gross National Income per capita. I wrote earlier that “the best outcome for the TPP intellectual property negotiations, from a public health point of view, would be for the chapter to reassert TRIPS, including the flexibilities found within it, and to leave out anything else… [but] if TPP negotiators do adopt a plan that includes differential treatment based on a threshold under which countries would be exempt from some of the TRIPS-Plus provisions, then the use of the World Bank’s High Income classification is not optimal.” (see also: other critiques of the GNI per capita approach by James Love, Brook Baker, and Médecins Sans Frontières).
Per capita income is one thing to consider when trying to gauge people’s ability to pay for needed medicines, but it not the only thing. Others include a country’s health profile of (i.e.- is the country’s population relatively older than others’, or does it face higher disease burdens); its income distribution; and to what degree its health spending is covered by public or private insurance, versus out-of-pocket. The earlier blog I mentioned focused on on measurements of health, so here I want look at income distribution.
Skewed income distribution will harm purchasing power for the majority of a country’s population. This is obvious, but applying it to TPP countries can illustrate the problem of using income as a guide for a TPP threshold. One way to think about income distribution and TPP thresholds is to consider the GNI-per-person of the bottom four quintiles of the population. Put differently, once the richest 20% of a country has gotten its share of the pie, what is left over for everybody else?
| Country | GNI 2012, Current USD |
Population | Top 20% Income Share | Income Share Data Year | GNI per capita as a whole | GNI per capita for bottom 80% |
| Australia | 1,488,643,540,536 | 22,723,900 | 0.41 | 1994 | 65,510 | 48,052 |
| Brunei Darussalam** | 10,784,466,286 | 412,238 | . | . | 26,161 | . |
| Canada | 1,788,807,958,028 | 34,754,312 | 0.40 | 2000 | 51,470 | 38,641 |
| Chile | 254,757,569,955 | 17,464,814 | 0.58 | 2009 | 14,587 | 7,713 |
| Japan | 6,126,320,465,841 | 127,561,489 | . | . | 48,026 | . |
| Malaysia | 293,358,215,203 | 29,239,927 | 0.51 | 2009 | 10,033 | 6,089 |
| Mexico | 1,166,798,875,465 | 120,847,477 | 0.53 | 2010 | 9,655 | 5,703 |
| New Zealand | 163,783,422,051 | 120,847,477 | 0.44 | 1997 | 1,355 | 953 |
| Peru | 186,843,897,486 | 29,987,800 | 0.53 | 2010 | 6,231 | 3,692 |
| Singapore | 280,096,315,320 | 5,312,400 | 0.49 | 1998 | 52,725 | 33,632 |
| United States | 16,514,500,000,000 | 313,873,685 | 0.46 | 2000 | 52,615 | 35,634 |
| Vietnam | 148,960,677,934 | 88,772,900 | 0.43 | 2008 | 1,678 | 1,187 |
If one assumes that income is the main driver of ability to pay the higher costs associated with stronger pharmaceutical IP, then one should look further than the overall income per capita, and try to look more closely at the actual purchasing power of the population. Income distribution is one factor that effects this.
———————————-
* Unfortunately, income distribution data is often out of date, regardless of the source. Here, I have used the most up to date data from the World Bank, and I have shown the year from which it comes. Other data sets, such as the UN WIDER dataset, have similar problems.
** The most recent year for which the World Bank has GNI data is 2009, which is used here.


