 This post uses two common indicators of innovation to see how the technology hardware sector compares in countries with and without fair use. It illustrates that research and development spending by firms in these industries has been higher in countries with fair use, controlling for other firm- and country-level factors. It then shows more patents have been granted to the technology sector in countries that have adopted fair use, relative to patents granted to firms in the same industries in other countries, controlling for other country-level factors.
Introduction
Countries around the world are revising their copyright laws to better balance the interests of creators and users of copyrighted work, and to keep up with technological change. Some are considering the adoption of fair use. For the purpose of this post, fair use is defined as a copyright exception that it is open to uses for any purpose, can apply to specific uses not listed elsewhere in the copyright code, and is flexibly applied according to a factor test.
There is a small-but-growing literature describing how fair use can incentivize innovation in certain industries that rely on limitations to copyright protection. These industries include (but are not limited to) online platforms, internet services, software, and hardware – all of which may be used by customers to access, reproduce, or share unauthorized copies of copyrighted works.
Fred Von Lohman argues that the way fair use permits “non-transformative, personal-use copying” by consumers “draws investment to technologies that are complementary goods to copyrighted works.” The private copying enabled by fair use acts as a “reservoir of incentive for tech innovators, attracting investment.” Rogers and Szamosszegi suggest that technology hardware firms are indirectly incentivized by fair use. Their study argues that fair use is necessary for a number of functions we think of as normal technology use, such as online searching and commerce. These activities create greater demand for consumer, B2C and B2B hardware used to interact with the new technology. For example, the ability to share and receive social media posts, which may include copyrighted images or video clips, drives demand for computers and smartphones.
Two studies show how recent consumer recording technologies have been affected by fair use (or the lack thereof). Josh Lerner shows that after a 2008 court ruling which clarified that fair use permitted firms to sell consumers recording devices that would store content for them remotely, “venture capital investment to remote additional incremental investment in U.S. cloud computing firms that ranged from $728 million to approximately $1.3 billion over the two-and-a-half years” relative to EU companies. Conversely, Rebecca Giblin notes that the lack of fair use in Australia has delayed the availability of certain consumer goods. For instance, digital home recording (i.e.- TiVo) entered the Australian market ten years after the American one, and the versions that were offered had fewer features, due to restrictions put in place by copyright law.
Roya Ghafele and Benjamin Gibert compare industry-level data from Singapore before and after the country amended its copyright law in 2006 to add an open fair use exception. The authors examine data from the private copying industries – defined as “those industries that manufacture and sell technologies and related electronic components, infrastructure and services, that enable consumers to record, store and transmit copyrighted materials for their own personal use.” They find that “fair use policy is correlated with higher growth rates” relative to a control group of other industries.
The purpose of this post is to test the assertions made previously that fair use can have a positive effect on innovation in the technology hardware sector. I hypothesize that the general and flexible qualities of fair use gives the law the needed malleability to permit unauthorized uses in unforeseen circumstances. This makes it particularly well suited to promote innovation in the technology hardware sector, where innovations may make it easier for users to access, reproduce, and/or share copyrighted works without authorization.
This is examined in two ways. First, I test whether the presence of fair use in a firm’s nation of domicile affects its level of research and development spending at the firm level, controlling for firm- and country-specific factors. This uses R&D spending as an indicator of innovative inputs. Second, I use industry-level data on patents granted to specific industries by country to see if the level of patenting by countries that have fair use differs from the level of patenting by countries that do not. This uses patent data as an indicator of innovative outputs.
Part 1: Firm-Level Research and Development Spending
Firm-level data on the dependent variable – research and development spending by firms in the “Technology Hardware” sector – is taken from Thomson Reuters Datastream and converted into U.S. dollars. Thomson Reuters classifies businesses according to its own system of classification (similar to NAICS in the U.S. or ISIC internationally). For this post, I’ve used the “Business Sector” level of specificity, which is relatively broad. This level encompasses computers, phones, household electronics, semiconductors, office equipment, communications and networking systems, and electronic equipment and parts. This is a subset of a larger dataset PIJIP has compiled from Thomson Reuters to study industries that may be affected by copyright user rights.
There are 960 or more firm-level observations of R&D spending each year from 2000 to 2014. (Our larger dataset goes back to 1985, but I use the data from 2000 forward because earlier data for many firms in non-OECD countries is slim before 2000.)
The independent variable of interest is Fair Use. It is a dummy variable that is equal to one if the law of the country in which a firm was based included fair use in its copyright law. The dataset includes data from firms in each of the seven countries in the world with fair use – the U.S., the Philippines, Singapore, Israel, Taiwan, Malaysia, and Korea. In order to determine whether a firm-level observation is from a country “with fair use,” both the country and year are considered. For instance, Singapore amended its copyright law to include fair use in 2006 (and the law took effect in January of that year), so the value of my Fair Use variable for observations of Singaporean firms up-to-and-including 2005 is equal to zero, and observations from 2006 forward are equal to one.
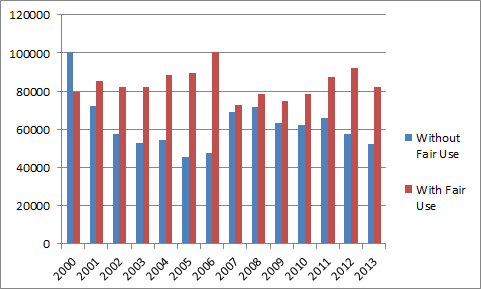
Figure 1 shows the mean value for R&D spending by firms with and without fair use for each year from 2000 through 2013. As the figure shows, firms in countries with fair use tended to spend more than other firms. However, there is much variation in the data, and the comparison does not control for other factors that could influence R&D. The next section describes regressions that control for some of these factors.
Figure 1: R&D Spending by Technology Hardware Firms in Nations With and Without Fair Use
I run a pair of panel regressions on logged R&D spending which test the effect of fair use while controlling for firm size and income (indicated by the number of employees and net sales and revenues in U.S. dollars, respectively) using data also taken from Thomson Reuters. In its raw form, the data on R&D spending, employment, and income are highly skewed, so the variables are logged to approximate normal distributions. I control for the wealth of each firm’s home economy using GDP per capita income from the IMF, entered into the dataset in units of thousands of US dollars. To account for different variations in the data from different nations, cluster the standard errors by nation.
The table below shows the results of the two panel regressions testing the effect of Fair Use while controlling for firm size, income, home-country wealth, and country and time fixed effects. Approximately 26% of the observations in Equation 1 are from firms based in the United States, so Equation 2 is run to test the effect of Fair Use in a subsample of non-U.S. firms.
In both equations, the coefficient on the fair use variable is positive and statistically significant at the 99% level, indicating that firms in this sample that operated in country/years with fair use spent, on average, more money on R&D than the other firms, controlling for firm size, income, national wealth, and time. Formally, the data from the sample in Equation 1 predicts that if a firm’s home country adopted fair use, holding everything else constant, the firm would be likely to spend 5.25% more on research and development. Equation 2 predicts that a firm in such a country would be likely to spend 6.16% more on research and development.[1]
The control variables also have positive coefficients that are statistically significant at the 99% level, as expected. It is notable that the coefficients on Employment and Net Sales and Revenue are larger than the others, indicating that the primary drivers of firm R&D in the sample are firm size and income, though other factors have a significant effect as well. The use of fixed effects controls for national differences that are difficult to measure, but that are unique to each country. Examples could include cultural differences between countries or the type of governance structures in place. The R-squared values of .64 and .61 indicate a reasonably good overall fit.
Table 1: Firm-level spending on research and development.
Standard errors are shown in parentheses and *** indicates 99% significance.
| Variable | Panel regression with country and time fixed effects, all countries | Panel regression with country and time fixed effects, U.S. observations omitted |
| Fair Use |
.051*** |
.060*** |
| (Log) Employment |
.446*** |
.353*** |
| (Log) Net Sales & Revenue |
.311*** |
.427*** |
| GDP Per Capita (thous. USD) |
.016*** |
.013*** |
| Observations
Overall R2 Intra-class correlation |
12381 .64 87 |
9193 .61 .86 |
Part 2: Country-Level Data on Technology Patents
We ultimately want to have a sense of innovative outputs by firms in countries with and without fair use. There is no centralized data for the creation of new products, but patent data can act as a proxy for this type of innovative activity.
Patent data is attractive as an indicator for innovation for various reasons, but there are well-known problems with it too. The patent system records a lot of information that can be arranged by nation, time, field of technology, and in other ways. Patents describe inventions that have some level of commercial promise. However, many patents are linked to inventions that are novel and nonobvious, but lack economic significance (i.e. – a small change to an existing technology). On the other hand, there are many economically significant new technologies that are not patented. In order to make the best use of patent data, the data used here is restricted to patents in the same industry. Patents assigned to U.S. firms are not examined, in order to eliminate home-country bias. Finally, this is meant to be considered jointly with the section above on R&D spending by firms, so it is one of two innovation indicators.
To compare the number of patents filed by “technology hardware” firms in different countries, I use data from a report patenting by industry and location prepared by the USPTO Patent Technology Monitoring Team. The report matches the technology codes found on patents to the industry codes (NAICS) used by researchers to categorize firms, providing a rare off-the-shelf resource for annual patent data broken down by both country and industry.
The country-level observations in this dataset are total patents that were granted to firms classified under the NAICS Code 334 for “Computers and Electronic Products.” The sample of countries used are those which were home to firms in the R&D spending analysis above. The industry organization in this section is similar to the industry organization in the previous section, yet they are not exactly the same – therefore, I do not mean to suggest that only the firms in the previous section are receiving all of the patents in this section.
I run three panel regressions controlling for country and year fixed effects, with standard errors clustered by nation. Since patents are granted after a delay, I incorporate one- and two-year time lags into the second and third regressions, respectively. My dependent variable is Patents Granted, which refers to the number of U.S. patents assigned to technology classes that correspond to NAISC 334 in a given country each year from 2000 to 2012 (the most recent year available). Since the unit of measurement is a national count, the size of the sample is smaller; there 416 industry-country-level observations in each regression. My independent variable of interest is once again the dummy Fair Use, equal to 1 for observations where a given country had fair use in its copyright law in a given year. I control for the size of the national economy with the variable GDP, utilizing data from the IMF.
Table 2 shows the results for the patent counts in my sample. The coefficient on fair use is positive, but only significant at the 90% level, indicating that fair use is generally related positively to patenting activity, but there is a lot of variation in the data. This is true despite the controls for country and time fixed effects. Lagging the dependent variables to account for the time it takes for an innovation to become patented raises the coefficient slightly, yet it remains significant only at the 90% level.
Most of the variation in data (over 90% in each of the three specifications) is due differences across the countries, which is unsurprising due to the differences in patenting activity across countries in the sample. The overall R-squared is 0.40 in the model without lags, 0.44 when independent variables are lagged one year, and 0.48 when lagged two years. This indicates that the overall fit of the model to the data in this sample improves with the addition of time lags, yet there is still a lot of unexplained variation in the data.
Overall, the regressions using patent data suggest that firms in countries with fair use received more patents on average than firms in countries without fair use, controlling for time and national wealth. However, patent data is known to be an imperfect indicator of innovation, and there is a lot of variation in the data.
Table 2: Country-level count of U.S. patents granted to technology classes corresponding to NAICS 334
Standard errors are shown in parentheses and *** indicates 99% significance,
** indicates 95% significance, * indicates 90% significance.
| Variable | Model 1: No lags |
Model 2: Independent variables lagged one year |
Model 3: Independent variables lagged two years |
| Fair Use |
828.60* |
901.42* |
991.85* |
| GDP |
.70** |
.77** |
.92** |
| Overall R2 Intra-class Correlation |
.40 |
.44 |
.48 |
Conclusion
This post has described two exercises testing the relevance of fair use to innovative activity in the technology hardware sector; one of the sectors thought to rely upon the robustness and flexibility of copyright exceptions. The first used a sample of firm-level data to show that firms based in countries with fair use were likely to spend more on research and development, controlling for other factors such as firm income, firm size, national wealth, and time. The second used country-level data to show that more patents were granted in technology fields that correspond to the same group of industries in countries with fair use than without, controlling for time and wealth. In both sections, we find that other factors may play a bigger role in promoting R&D spending or patenting activity, but that fair use still has a significant effect.
———————————————
[1] The difference between the coefficients reported in the table and the predicted effect are due to the interpretation of a coefficient on a dummy variable in a regression with a logged dependent variable. For a succinct explanation see “Dummies for Dummies” in Dave Giles’ Econometrics Beat.


